Before a while, I had written a post about monitoring a single Linux system. It was being done by Nagios and its magic. I am still a huge Nagios lover and fan, so this stays of course.
Recently, I've been discovered NetData application (https://github.com/netdata/netdata).
Netdata is distributed, real-time, performance and health monitoring for systems and applications. It is a highly optimized monitoring agent you install on all your systems and containers.
Netdata provides unparalleled insights, in real-time, of everything happening on the systems it runs (including web servers, databases, applications), using highly interactive web dashboards. It can run autonomously, without any third party components, or it can be integrated into existing monitoring toolchains (Prometheus, Graphite, OpenTSDB, Kafka, Grafana, etc).
Netdata is fast and efficient, designed to permanently run on all systems (physical & virtual servers, containers, IoT devices), without disrupting their core function.
Netdata is free, open-source software and it currently runs on Linux, FreeBSD, and MacOS.
In this blog post, I will describe how I have added multiple cPanel based servers with NetData to Prometheus and then to the Grafana tool.
Prometheus is a distributed monitoring system which offers a very simple set up along with a robust data model. Recently netdata added support for Prometheus.
I’m going to quickly show you how to install both netdata and Prometheus on the client and server. We can then use grafana pointed at Prometheus to obtain long-term metrics netdata offers.
There is a number of ways to install netdata according to Installation (https://docs.netdata.cloud/packaging/installer/#installation).
The suggested way of installing the latest netdata and keep it upgrade automatically. Using one line installation:
bash <(curl -Ss https://my-netdata.io/kickstart.sh)
Since I am using xtendWeb application alongside cPanel, I can use the following bash script safely:
CLIENT SIDE INSTALLATION
1) /opt/nDeploy/scripts/easynetdatasetup.sh
2) edit /opt/netdata/netdata-config/netdata.conf
bind=0.0.0.0.0:19999
(you can here assign internal network IP address, VPN address or anything else)
3) If you are using CSF as a frontend firewall please do the following:
csf.allow:
tcp|in|d=19999|s=10.8.8.1
tcp|out|d=19999|s=10.8.8.1
csf.deny:
tcp|in|d=19999|d=0.0.0.0/0 # do not delete
(that do not delete is important comment because CSF is not going to remove it when doing cronjob/updates). What we did here is that we have whitelisted originated Prometheus/Grafana server, and blocked everything else, of course in the CSF style. You can use native IPtables to accomplish this, firewalld or any other popular firewall tools.
At this point, we should have netdata listening on port 19999. Attempt to take your browser here:
http://your.netdata.ip:19999
(replace your.netdata.ip with the IP or hostname of the server running netdata), or http://your.netdata.ip/netdata if you are using XtendWeb netdata bash script to test it. This is everything needed to be installed on the client server, VPS, docker or anywhere else.
SERVER SIDE INSTALLATION (PROMETHEUS/GRAFANA)
-- Installing Prometheus --
In order to install Prometheus, we are going to introduce our own systemd startup script along with an example of prometheus.yaml configuration. Prometheus needs to be pointed to your server at a specific target url for it to scrape netdata’s api. Prometheus is always a pull model meaning netdata is the passive client within this architecture. Prometheus always initiates the connection with netdata.
1) Download Prometheus:
wget -O /tmp/prometheus-2.3.2.linux-amd64.tar.gz https://github.com/prometheus/prometheus/releases/download/v2.3.2/prometheus-2.3.2.linux-amd64.tar.gz
2) Create a Prometheus system user:
sudo useradd -r prometheus
3) Create a Prometheus directory:
sudo mkdir /opt/prometheus
sudo chown prometheus:prometheus /opt/prometheus
4) Untar prometheus directory:
sudo tar -xvf /tmp/prometheus-2.3.2.linux-amd64.tar.gz -C /opt/prometheus --strip=1
-- prometheus.yml adjustments --
We will use the following prometheus.yml file. Save it at /opt/prometheus/prometheus.yml.
Make sure to replace your.netdata.ip with the IP or hostname of the host running netdata.
[root@one ~]# cat /opt/prometheus/prometheus.yml
# my global config
global:
  scrape_interval:     5s # Set the scrape interval to every 5 seconds. Default is every 1 minute.
  evaluation_interval: 5s # Evaluate rules every 5 seconds. The default is every 1 minute.
  # scrape_timeout is set to the global default (10s).

  # Attach these labels to any time series or alerts when communicating with
  # external systems (federation, remote storage, Alertmanager).
  external_labels:
      monitor: 'codelab-monitor'

# Load rules once and periodically evaluate them according to the global 'evaluation_interval'.
rule_files:
  # - "first.rules"
  # - "second.rules"

scrape_configs:

  - job_name: 'netdata-hostname'

    metrics_path: '/api/v1/allmetrics'
    params:
      # format: prometheus | prometheus_all_hosts
      # You can use `prometheus_all_hosts` if you want Prometheus to set the `instance` to your hostname instead of IP
      format: [prometheus_all_hosts]
      #
      # sources: as-collected | raw | average | sum | volume
      # default is: average
      #source: [as-collected]
      #
      # server name for this prometheus - the default is the client IP
      # for netdata to uniquely identify it
      #server: ['prometheus1']
    honor_labels: true

    static_configs:
      - targets: ['hostname:19999']

  - job_name: 'netdata-hostname0'

    metrics_path: '/api/v1/allmetrics'
    params:
      # format: prometheus | prometheus_all_hosts
      # You can use `prometheus_all_hosts` if you want Prometheus to set the `instance` to your hostname instead of IP
      format: [prometheus_all_hosts]
      #
      # sources: as-collected | raw | average | sum | volume
      # default is: average
      #source: [as-collected]
      #
      # server name for this prometheus - the default is the client IP
      # for netdata to uniquely identify it
      #server: ['prometheus1']
    honor_labels: true

    static_configs:
      - targets: ['hostname0:19999']


  - job_name: 'netdata-hostname1'

    metrics_path: '/api/v1/allmetrics'
    params:
      # format: prometheus | prometheus_all_hosts
      # You can use `prometheus_all_hosts` if you want Prometheus to set the `instance` to your hostname instead of IP
      format: [prometheus_all_hosts]
      #
      # sources: as-collected | raw | average | sum | volume
      # default is: average
      #source: [as-collected]
      #
      # server name for this prometheus - the default is the client IP
      # for netdata to uniquely identify it
      #server: ['prometheus1']
    honor_labels: true

    static_configs:
      - targets: ['hostname1:19999']

  - job_name: 'netdata-hostname2'

    metrics_path: '/api/v1/allmetrics'
    params:
      # format: prometheus | prometheus_all_hosts
      # You can use `prometheus_all_hosts` if you want Prometheus to set the `instance` to your hostname instead of IP
      format: [prometheus_all_hosts]
      #
      # sources: as-collected | raw | average | sum | volume
      # default is: average
      #source: [as-collected]
      #
      # server name for this prometheus - the default is the client IP
      # for netdata to uniquely identify it
      #server: ['prometheus1']
    honor_labels: true

    static_configs:
      - targets: ['hostname2:19999']
Note: Key points here are job-name and targets. As Prometheus Yaml structure says, you can combine multiple targets into single job-name, or you can split them as I've stated in my working example here which added 4 active hostnames (servers).
-- Optional: nodes.yml --
The following is completely optional, it will enable Prometheus to generate alerts from some NetData sources. Tweak the values to your own needs. We will use the following nodes.yml file below. Save it at /opt/prometheus/nodes.yml, and add a - “nodes.yml” entry under the rule_files: section in the example prometheus.yml file above.
groups:
- name: nodes

  rules:
  - alert: node_high_cpu_usage_70
    expr: avg(rate(netdata_cpu_cpu_percentage_average{dimension="idle"}[1m])) by (job) > 70
    for: 1m
    annotations:
      description: '{{ $labels.job }} on ''{{ $labels.job }}'' CPU usage is at {{ humanize $value }}%.'
      summary: CPU alert for container node '{{ $labels.job }}'

  - alert: node_high_memory_usage_70
    expr: 100 / sum(netdata_system_ram_MB_average) by (job)
      * sum(netdata_system_ram_MB_average{dimension=~"free|cached"}) by (job) < 30
    for: 1m
    annotations:
      description: '{{ $labels.job }} memory usage is {{ humanize $value}}%.'
      summary: Memory alert for container node '{{ $labels.job }}'

  - alert: node_low_root_filesystem_space_20
    expr: 100 / sum(netdata_disk_space_GB_average{family="/"}) by (job)
      * sum(netdata_disk_space_GB_average{family="/",dimension=~"avail|cached"}) by (job) < 20
    for: 1m
    annotations:
      description: '{{ $labels.job }} root filesystem space is {{ humanize $value}}%.'
      summary: Root filesystem alert for container node '{{ $labels.job }}'

  - alert: node_root_filesystem_fill_rate_6h
    expr: predict_linear(netdata_disk_space_GB_average{family="/",dimension=~"avail|cached"}[1h], 6 * 3600) < 0
    for: 1h
    labels:
      severity: critical
    annotations:
      description: Container node {{ $labels.job }} root filesystem is going to fill up in 6h.
      summary: Disk fill alert for Swarm node '{{ $labels.job }}'
-- Create prometheus service --
[Unit]
Description=Prometheus Server
AssertPathExists=/opt/prometheus

[Service]
Type=simple
WorkingDirectory=/opt/prometheus
User=prometheus
Group=prometheus
ExecStart=/opt/prometheus/prometheus --config.file=/opt/prometheus/prometheus.yml --log.level=info
ExecReload=/bin/kill -SIGHUP $MAINPID
ExecStop=/bin/kill -SIGINT $MAINPID

[Install]
WantedBy=multi-user.target
Start Prometheus service and enable it:
sudo systemctl start prometheus
sudo systemctl enable prometheus
Prometheus should now start and listen on port 9090. Attempt to head there with your browser.
If everything is working correctly when you fetch http://your.prometheus.ip:9090 you will see a ‘Status’ tab. Click this and click on ‘targets’ We should see the netdata host as a scraped target.
This is my example (screenshot):
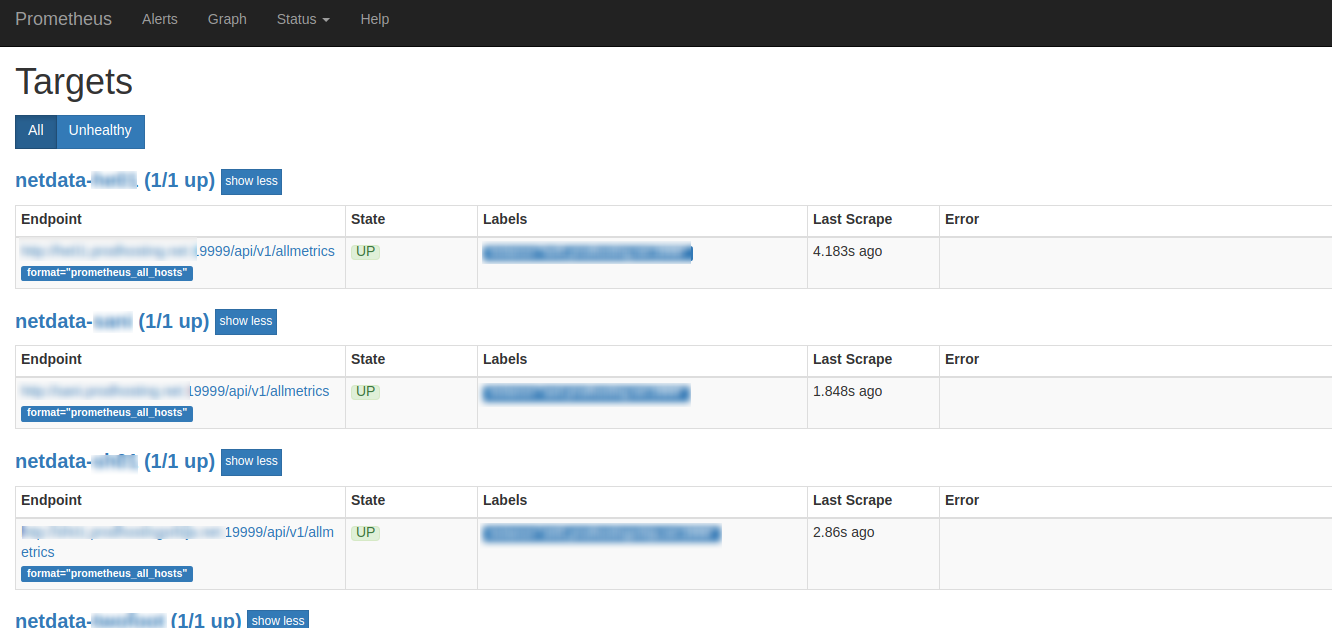
Note: As I've said before you can limit access to Prometheus using firewall service as actively it does not have any authentication built-in.
GRAFANA INSTALLATION AND INTEGRATION
What is Grafana?
Grafana is software for data visualization & Monitoring with support for Graphite, InfluxDB, Prometheus, Elasticsearch and many more databases.
More details about Grafana project you can read here:
https://grafana.com/
To install grafana on the server side, please do the following:
1) curl -s https://packagecloud.io/install/repositories/grafana/stable/script.rpm.sh | sudo bash
2) sudo yum install grafana-5.4.2-1.x86_64
3) systemctl start grafana-server
4) systemctl status grafana-server
5) systemctl enable grafana-server
At this point you should have active grafana listening on default port 3000, in my example the GUI access is:
http://10.8.8.1:3000
Initially default username/password for Grafana is admin/admin. After first entry, you will be asked to change it to something else. When you are logged inside, we need to add Prometheus as Data source.
To do that:
- Navigate to Configuration --> Data Sources
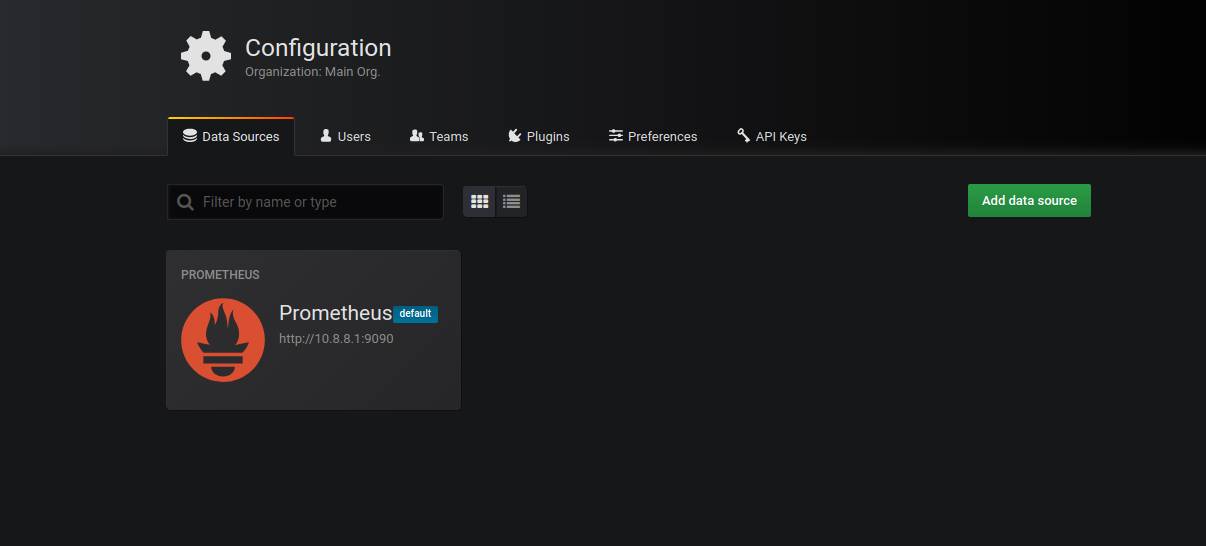
Click on the ADD DATA SOURCES, SELECT PROMETHEUS and fill up these fields carefully:
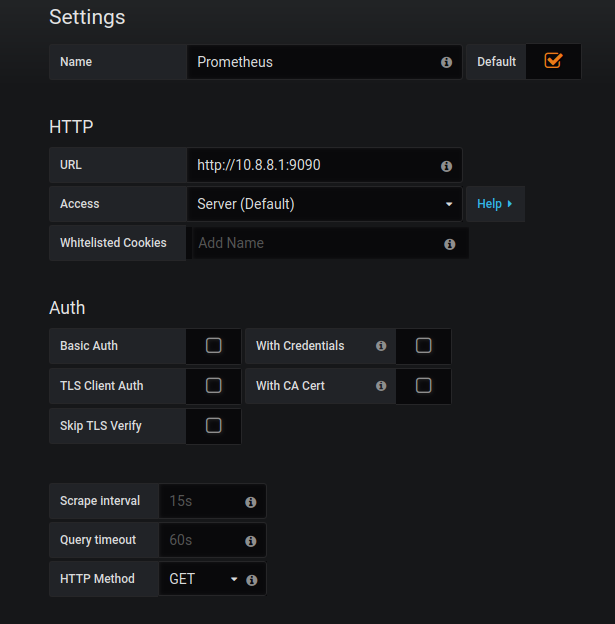 In my example the Prometheus server is assigned as 10.8.8.1:9090, but you can use public, internal or vpn IP address as I've stated before.
Next, you need to navigate to http://10.8.8.1:3000/dashboard/import (or + sign at left sidebar then IMPORT)
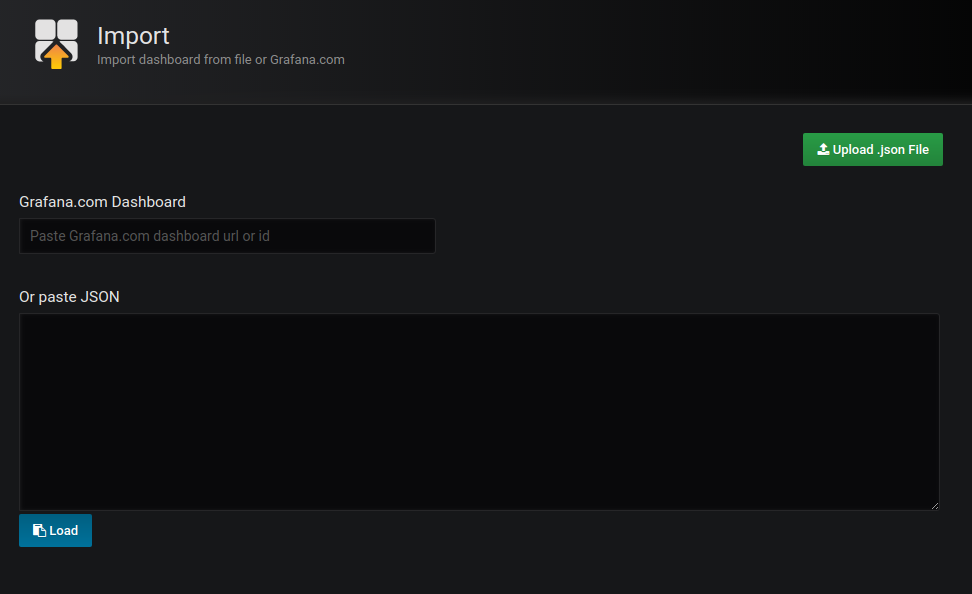
There are few popular NetData ready made Dashboards using Prometheus. I've picked up https://grafana.com/dashboards/7107. You can simply import that one and start using it, or you can easily create your own Dashboard instead.
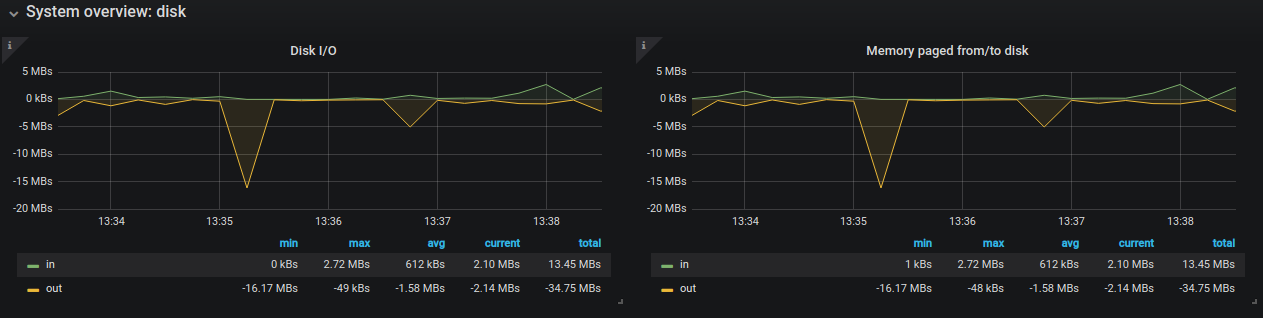
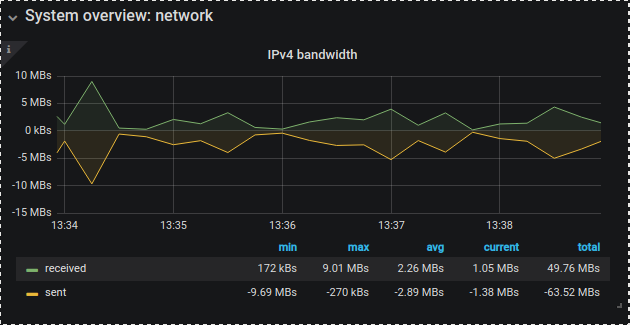
Now that everything is installed you can safely navigate to the Dashboard and enjoy. I will paste here a few active examples from monitoring my 4 servers:
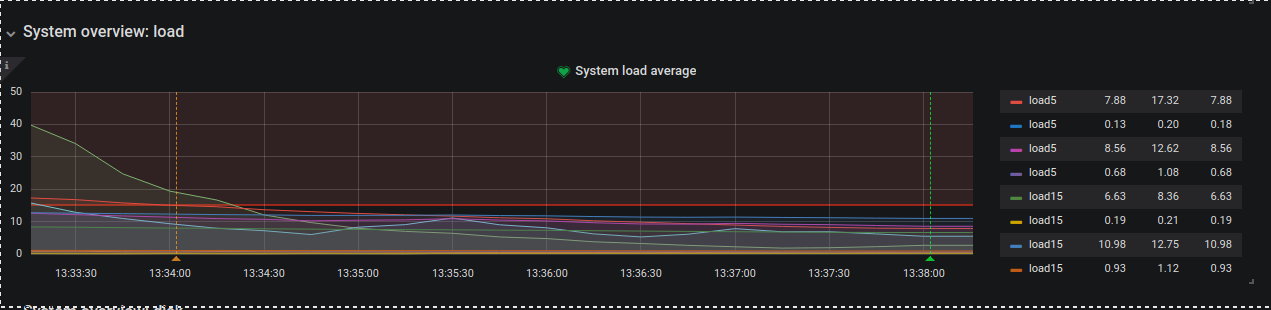
And the one I especially like is CPU app time grap where you can setup Alert to get notified on Email or even Better SLACK!
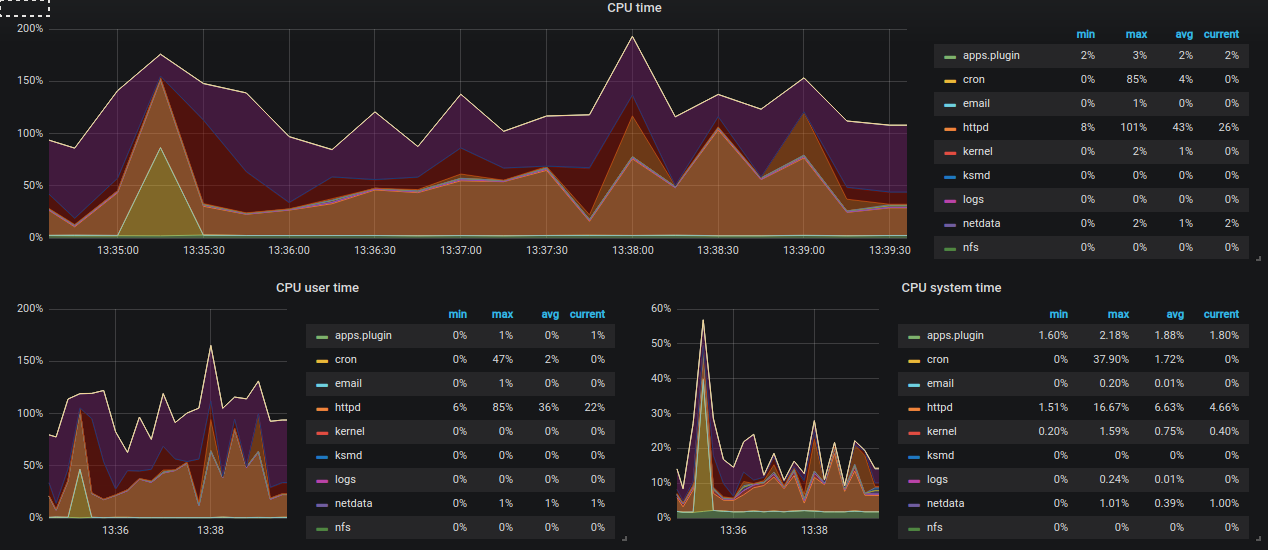
The Grafana Slack integration is nicely explained on the http://docs.grafana.org/alerting/notifications/#slack page, so please just follow it and enjoy.
Conclusion:
We have today installed netdata metric gather tool on four separate servers, installed prometheus/grafana on the separate server which will be used to collect data and alert us if resource usage on instances become unstable or beyond defined levels. I hope this article helps anyone with needs to monitor multiple servers at the same time.
Reference articles:
https://docs.netdata.cloud/backends/walkthrough/
https://github.com/netdata/netdata
https://grafana.com/dashboards/7107
http://docs.grafana.org/alerting/notifications/#slack